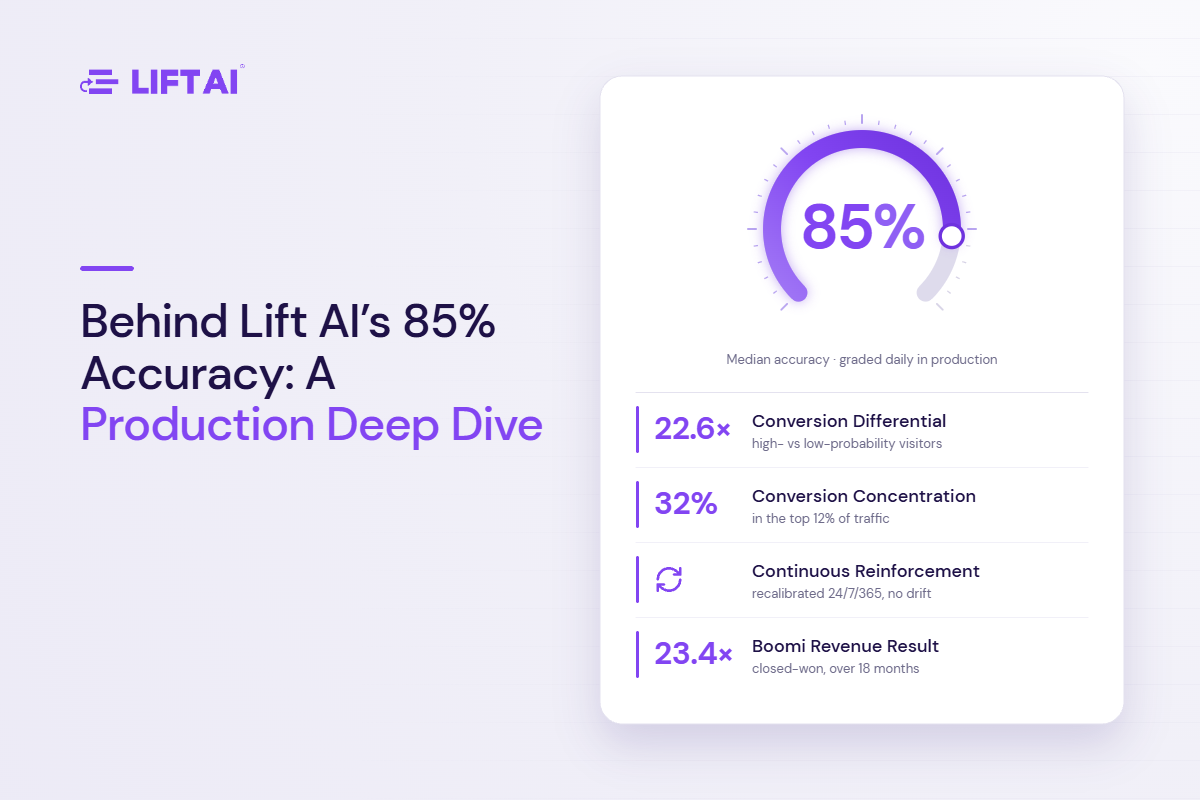
Lift AI’s production model achieves 85%+ audited accuracy — graded against real outcomes — with a 22.6× median conversion differential between high- and low-probability segments. Here’s what those figures measure, how they’re validated daily in production, how they stay stable over time, and how they translate into a client-verified 23.4× closed-won revenue result at Boomi.
85%+ median accuracy, graded against actual outcomes
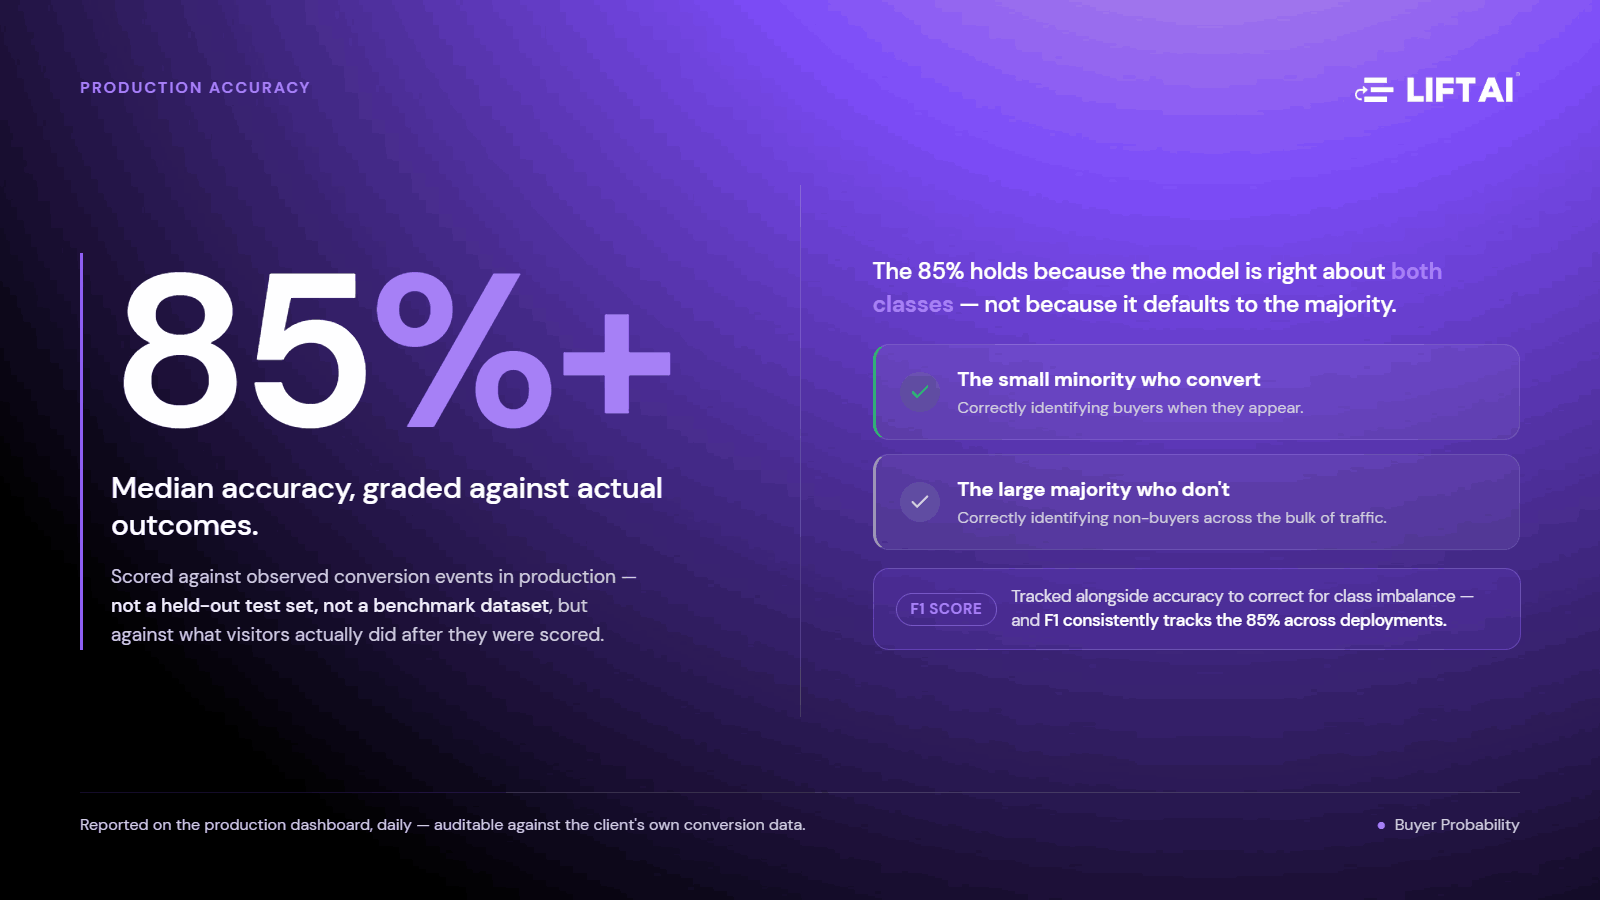
Lift AI’s predictions are scored against actual conversion outcomes in production — not against a held-out test set, not a benchmark dataset, but against what visitors actually did after they were scored. Across deployments, the median of per-deployment accuracy is 85%+ when buying-probability predictions are graded against observed conversion events.
Accuracy alone is a weak metric on imbalanced data — a model that predicted “no conversion” for every visitor would score above 99% on most B2B traffic and be operationally useless. So accuracy is tracked alongside F1 score, which corrects for class imbalance by weighting precision and recall equally. F1 consistently tracks the accuracy figure across deployments, confirming the model performs on both classes: correctly identifying buyers when they appear, and correctly identifying non-buyers across the much larger majority of traffic. The 85% holds because the model is right about both the small minority who convert and the large majority who don’t — not because it defaults to the majority class.
This is the figure reported on the production dashboard daily. It’s the number a client can audit, challenge, and verify against their own conversion data.
How the model performs: conversion concentration and conversion differential
The operationally meaningful question isn’t aggregate accuracy — it’s whether the model can identify the small minority of visitors ready to buy and separate them from the vast majority who are not. Two related metrics measure this: conversion concentration and conversion differential.
Across production deployments spanning B2B SaaS, B2B healthcare, B2C real estate, and B2C ecommerce, the model concentrates a median 32% of all conversions into the top 12% of scored traffic. This holds consistently across industries and at scales from 10,000 to 8.1 million monthly visitors per deployment. In practice, every chat conversation, agent action, ad dollar, and enrichment credit directed at the high-probability segment is 2.67× more likely to produce a conversion than an unscored approach.
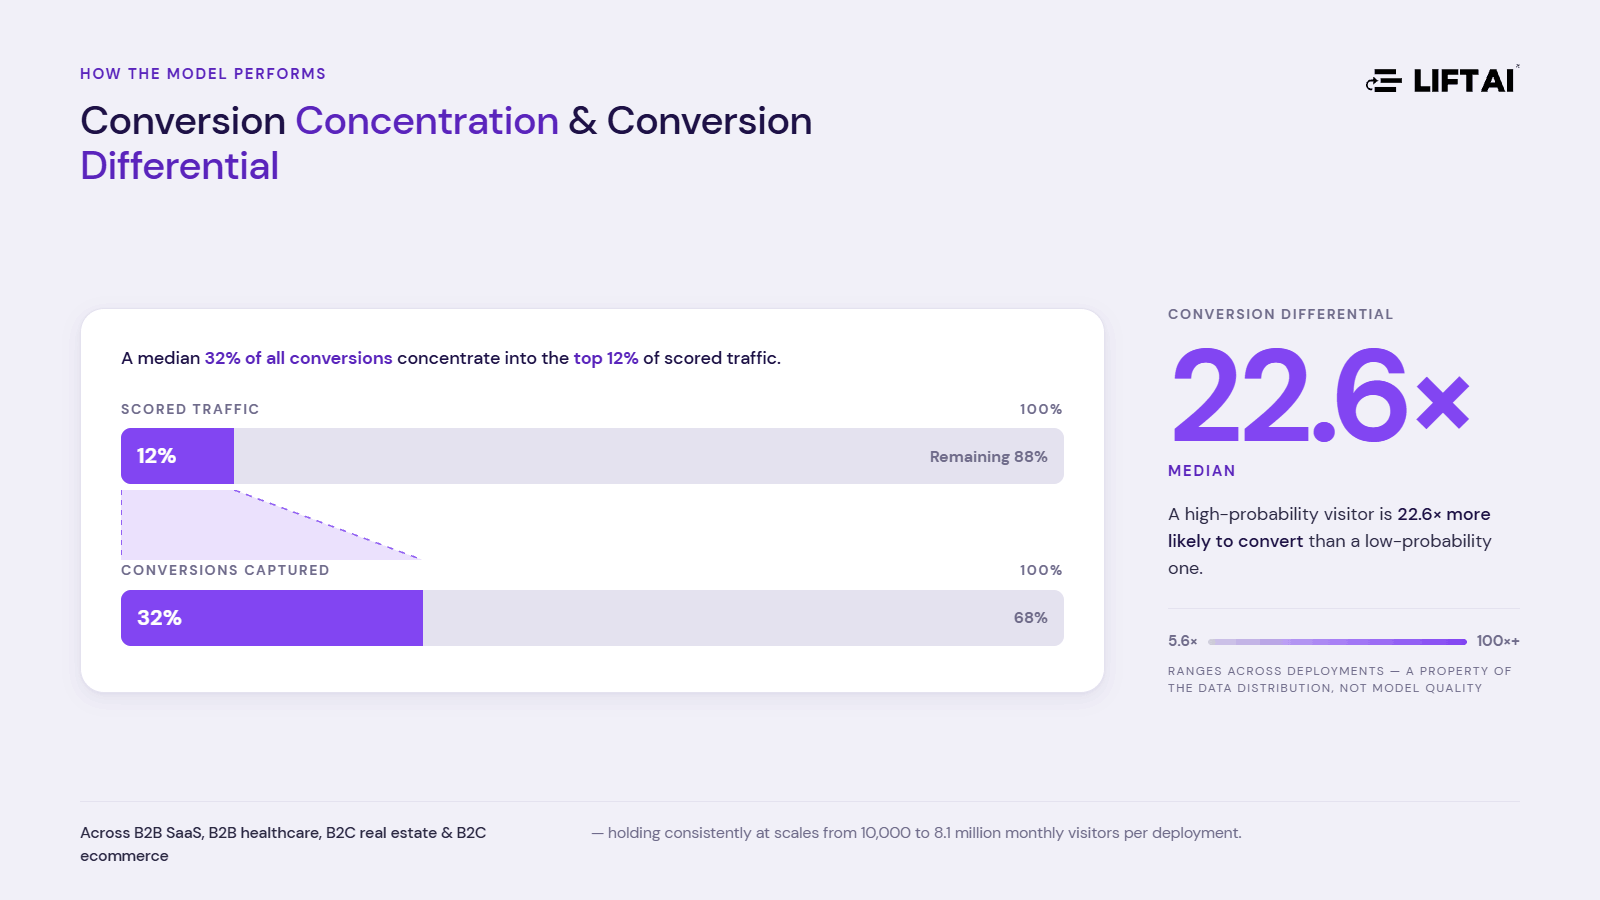
The same separation expressed as a ratio between segments — the conversion differential — is a median 22.6×: a high-probability visitor is 22.6× more likely to convert than a low-probability one. The differential ranges from 5.6× to over 100× across deployments, and that variation is a property of the data distribution, not model quality. In very low-conversion environments where fewer than 0.1% of visitors convert on a single event, differentials exceed 100× because the low-probability denominator approaches zero; in higher-conversion environments like B2C ecommerce, they compress to 6–23×. Conversion concentration is the more distribution-stable metric, which is why it’s reported alongside the differential rather than in place of it.
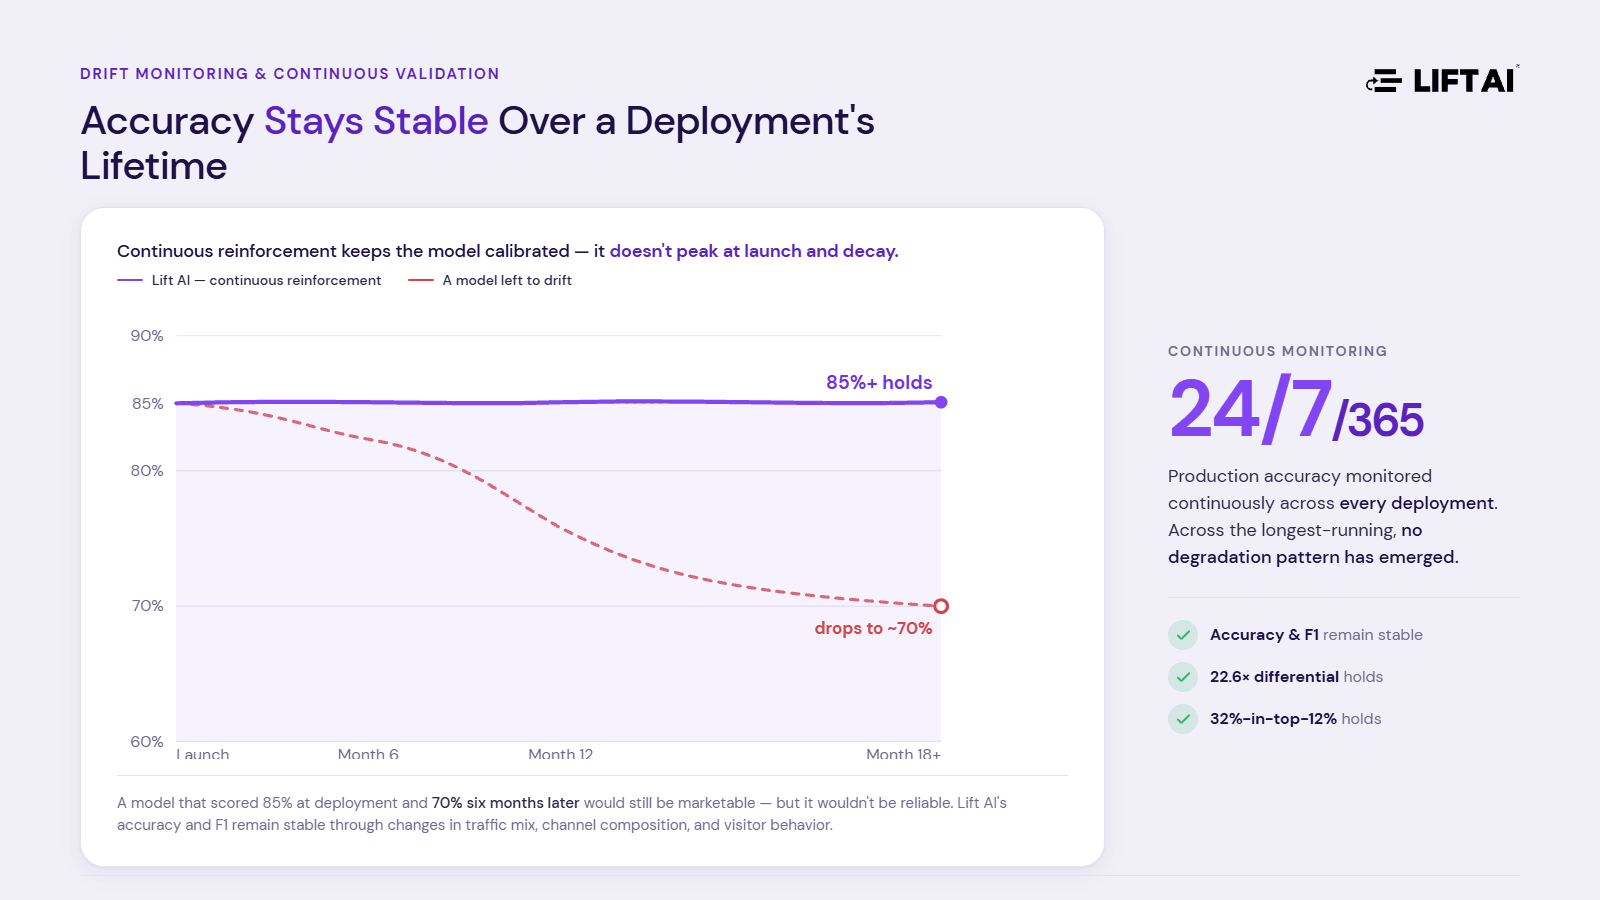
Drift monitoring and continuous validation
Models trained on historical behavior decay when behavior changes — with seasons, market conditions, product launches, and shifts in how buyers research. A model that scored 85% accurate at deployment and 70% six months later would still be marketable, but it wouldn’t be reliable.
Lift AI monitors production accuracy continuously across every deployment — 24/7/365. Across the longest-running deployments, no degradation pattern has emerged that would require retraining outside the continuous reinforcement loop; accuracy and F1 remain stable through changes in traffic mix, channel composition, and visitor behavior. Continuous reinforcement keeps the model calibrated to current patterns rather than drifting from the ones it was originally trained on. This is what keeps the 22.6× conversion differential and the 32%-in-top-12% conversion concentration stable over a deployment’s lifetime, rather than peaking at launch and decaying.
The validation is visible, not asserted. The accuracy dashboard isn’t a quarterly report or an internal tool — it updates daily, in production, with direct client access. Every piece of performance data (from our raw confusion matrix, to primary indicators like precision, recall, F1, conversion concentration, conversion differential, and accuracy trends) — is available for independent audit at any time. Most predictive vendors report accuracy as a single number in a pitch deck and ask the buyer to take it on trust. A probability model is only as credible as its production performance, and production performance is only verifiable if the client can see it themselves.
Client-verified result: Boomi — 23.4× closed-won revenue
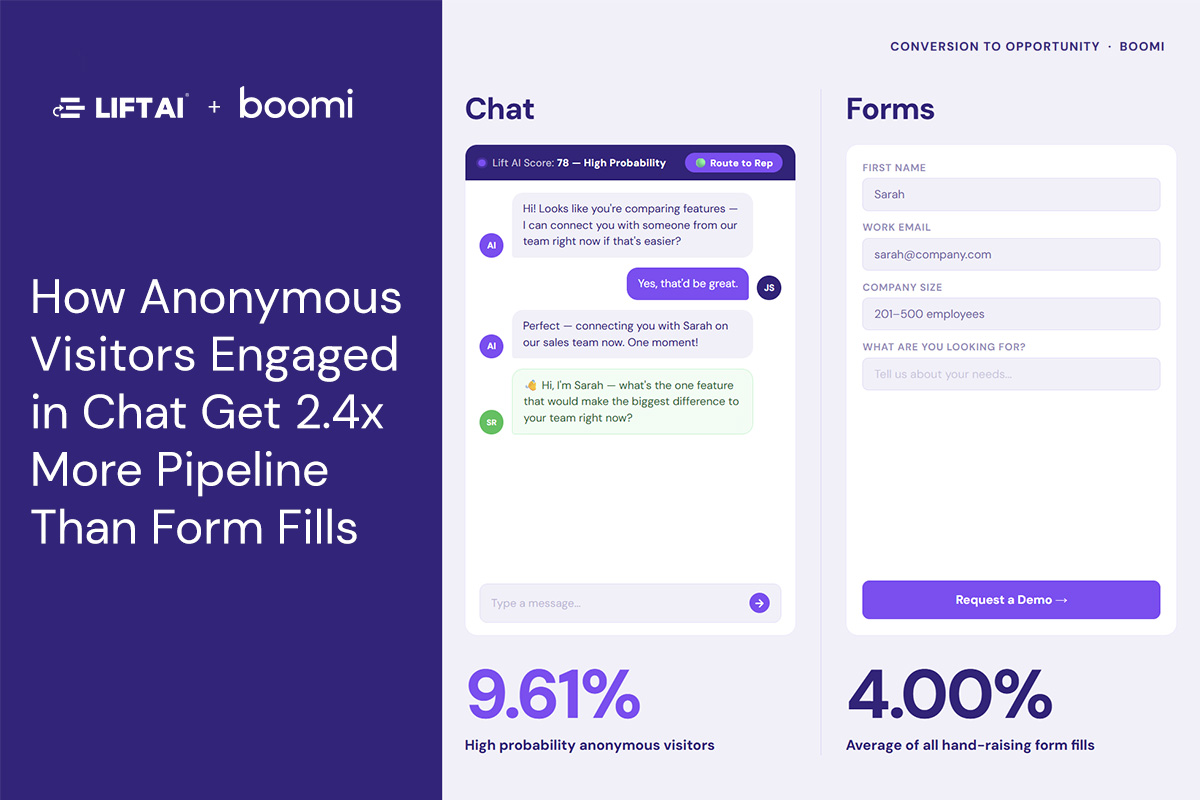
The strongest test of a probability model is what happens when a client routes a real commercial operation through it. Over an 18-month deployment, Boomi replaced page-based chat triggers with Lift AI’s probability scoring. The intervention was the score. Everything else held constant: same website, same sales team, no headcount changes, no process overhaul. Conversational-AI-attributed revenue, measured through to closed-won deals, increased 23.4×.
The mechanism is the four-lever compounding effect of concentrated targeting. With page-based triggers, Boomi engaged 8.25% of visitors. With probability-based triggers calibrated to the high-probability segment, the targeting pool expanded across the wider website to 31.72% — a 284% increase in addressable engagements, because the model identified high-probability visitors page rules missed entirely. Engagement-to-opportunity conversion rose from 3.6% to 5.4% (+50%), reflecting that the visitors being engaged were genuinely closer to buying. Opportunity-to-close moved from 5.4% to 14.2% (+163%) — a swing that usually requires sales-process or team change, but here came purely from better opportunity quality at the top of the funnel. Average contract value rose 55%, consistent with finding buyers earlier, before competitor framing set the benchmark.
Multiplied through, those four levers — targeting pool, conversion rate, close rate, and deal size — produce the 23.4× closed-won revenue multiple (3.84 × 1.50 × 2.63 × 1.55).
The dashboard for the same deployment shows where the lift starts. On Boomi’s production traffic, the model recorded a 10.5× conversion differential between high- and low-probability segments. The high-probability segment — 14.3% of traffic — captured 45.1% of demo-request conversions; the low-probability segment — 55.6% of traffic — captured only 16.7%. Nearly half of all demo conversions concentrated into the top 14% of scored traffic. A 10.5× top-of-funnel scoring differential, compounded through four downstream levers, produces a 23.4× revenue multiple at the bottom. Same site, same team. The only thing that changed was what the system paid attention to.
Why accuracy is the moat made measurable
Accuracy that performs on both classes, stays stable under drift, and survives independent audit is not primarily a modeling achievement — it's a data achievement. The model performs on both buyers and non-buyers because it was trained on the full visitor distribution; it stays calibrated because that foundation holds — and continuous monitoring against verified outcomes proves it stays that way, deployment after deployment. The 85%+ production performance is what the data advantage looks like in practice, and the daily, client-auditable dashboard is the proof that it’s real rather than asserted. Accurate buyer probability is a data problem first — and this is what solving it looks like under independent audit.
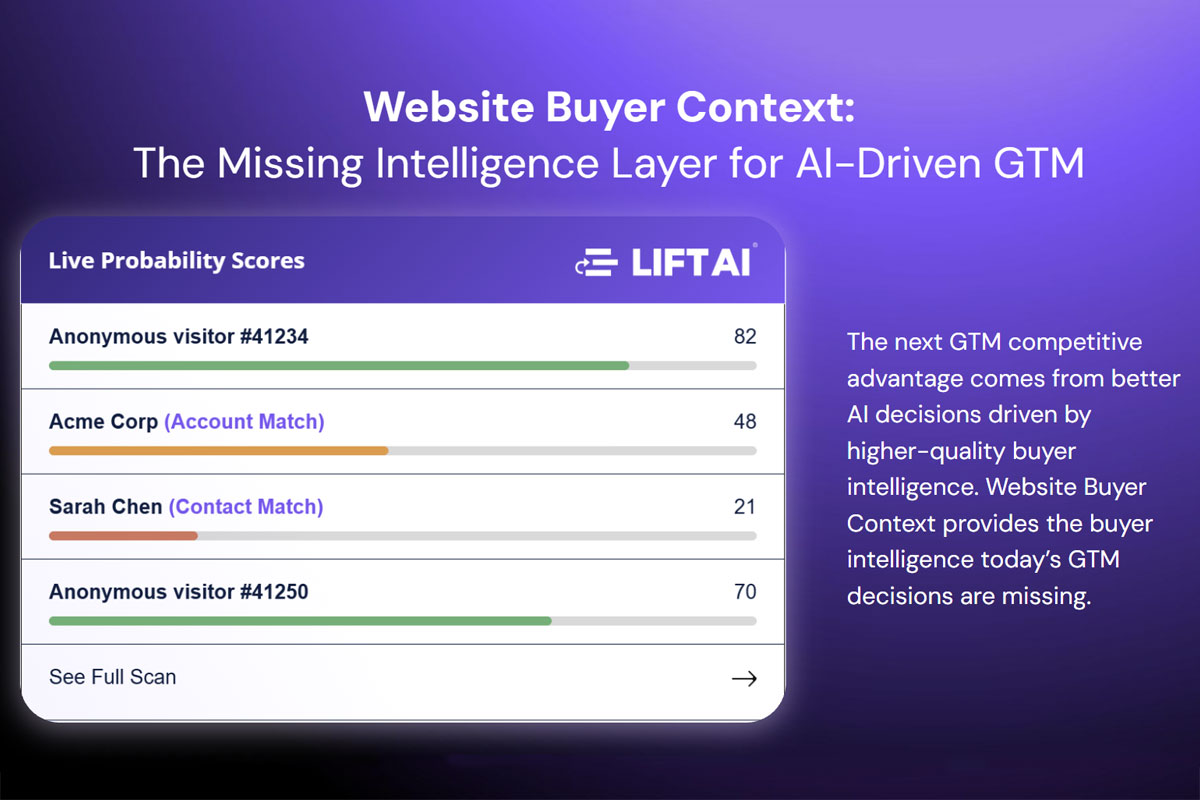
Lift AI is the Website Buyer Context layer for the GTM stack — one real-time Probability Score that tells every system how likely each website visitor is to buy, and the Buyer Context to act on it.