You can only manage what you measure, as the adage goes. Every company relies on data to inform its strategy and future actions.
For example, the growing cost of goods sold might indicate that you need to increase prices. Longer than usual response times might point to the fact that you don’t have enough people in customer support.
Metrics are also critical in sales. As sales bring in revenue, and revenue enables you to do everything else, it’s very important to track sales performance metrics at all times.
Not everyone, however, knows what sales metrics are, which ones they should track, and how. So let’s explore all the foundational sales metrics and key performance indicators (KPIs) that successful sales organizations and teams use to improve their results.
What Are Important Sales Metrics for Customers?
Sales metrics are simply indicators that measure the performance of an individual, team, or company. They help everyone stay on track with regards to goal completion, identify issues, and analyze historical performance.
Most sales metrics are reactive (also called lagging indicators) and only show what’s been already done. They are used to adjust future plans and come up with new strategies.
Some sales metrics can also be proactive (aka leading indicators) that predict results and show which way your sales strategy is trending — so you can make timely changes, if needed.
With that introduction, we can now dive into discussing sales metrics across a variety of categories.
Sales KPIs Measured Over Custom Time Periods
On a macro level, a CEO or VP of Sales should track metrics related to company-wide sales performance, such as:
- Total revenue from all sales activities and operations
- Revenue by product or service that breaks down the total revenue
- Revenue by market that shows the most profitable verticals
- Market share that calculates the number of customers you have vs. the total number of potential customers in the particular market
- Year-over-year growth that compares this year’s revenue at a certain date to last year’s revenue
- Customer lifetime value (LTV) that shows the average revenue that can be expected from each customer as long as they stay with the company
- Net Promoter Score (NPS) that estimates how likely your customers are to recommend your company to others
- Cost of goods sold (COGS) or selling expenses that measure what it takes to sell your product or service, especially as a percentage of overall revenue
Metrics for Sales Activities
Once you establish all the company-wide sales metrics, you can start tracking the general activity of sales reps to see if they are meeting their quotas and if any of the metrics can be improved.
Exact sales activity metrics would differ from company to company, but some general ones include the number of:
- Calls
- Emails
- Scheduled meetings
- Presentations or demos
- Referrals
- Proposals
Such metrics are proactive (or leading) as they influence future results.
Sales Funnel Metrics
Monitoring the health of your sales funnel and its conversion rates is the best predictor of your future sales revenues. The most effective way to measure your conversion funnel is over a specific time period, such as a month or a quarter.
Which metrics should you keep an eye on?
- Average sales cycle length should give you the time it takes someone to successfully go through all the stages of the funnel
- Open opportunities over a given time period
- Closed opportunities over a given time period
- Sales pipeline value should estimate how much all the deals in the funnel are worth
- Average deal size tracks the size of deals in your sales pipeline
- Closing rate is the percentage of total deals that are won
- Conversion rate by funnel stage measures how effective each stage of your funnel is at getting potential customers to the next stage
Lead Generation Sales Metrics
When it comes to evaluating how effective your BDRs are at prospecting, you should track sales metrics directly related to leads:
- New leads added to the pipeline
- Lead follow-ups (and within what timeframe)
- Leads dropped
- Leads qualified
- Customer acquisition cost (CAC)
You can also monitor your sales goals through outreach metrics in specific channels, such as email, phone calls, and social media:
- For emails, you can track open rates, engagement rates (e.g. clicks), and response rates
- For phone calls, conversations and call-backs
- For social media, the number of direct messages, conversions to the next step in the funnel
If your industry doesn’t rely on digital as much, you can similarly track the number of opportunities generated and meetings scheduled at trade shows or conferences.
Metrics for Sales Deals
For greater clarity when it comes to conversion rates, you should monitor the percentage of:
- Opportunities won
- Opportunities won by lead source
- Opportunities lost
An average number of conversations for both won and lost opportunities can also be valuable.
Metrics for Sales Processes and Training
If your sales team doesn’t get better all the time and doesn’t bring new BDRs up to speed effectively, it’s going to affect every one of your sales metrics in the long term.
In particular, you should track:
- How many sales reps are following the sales process
- How many sales reps are using scripts and templates
- How many sales reps are using CRM and other tools
- Average time spent in training (per month or quarter)
- Average cost of training per person
- How satisfied your team is with sales training
Marketing Metrics for SaaS Products
Companies that sell SaaS products are lucky when it comes to sales metrics because the software itself can tell them so much more.
However, it’s important to note that closing deals is not as important for SaaS companies as improving the customer lifetime value. Since recurring SaaS prices are lower than the upfront prices of traditional product businesses, it often takes longer for SaaS companies to break even, considering the customer acquisition costs.
Every SaaS company should track the following metrics:
- Customer acquisition cost (CAC) is usually derived by dividing the amount you spend on sales and marketing by the number of new customers over the same time period
- Cost per acquisition that is similar to CAC but includes non-customers like free users, trials, leads, etc.
- Average revenue per user is an important metric which can help you increase revenue while keeping the same number of customers
- Monthly (annual) recurring revenue shows how much revenue your SaaS product generates on a monthly (annual) basis
- Churn rate shows the percentage of customers who cancel their subscriptions in a given time period
How to Improve KPIs for Your Sales Team
We’ve described dozens of useful sales metrics above. It can seem too much to implement at first, so start with the ones that are the closest to the areas where your sales team can improve.
For example, you might find that your BDRs are spending too much time via chat with minimum effect because they are talking to unqualified website visitors and missing out on those who actually have high purchase intent.
As a result, you might look into a solution that can automate the qualification process and connect the most qualified opportunities directly to your BDRs. This is exactly what Lift AI does.
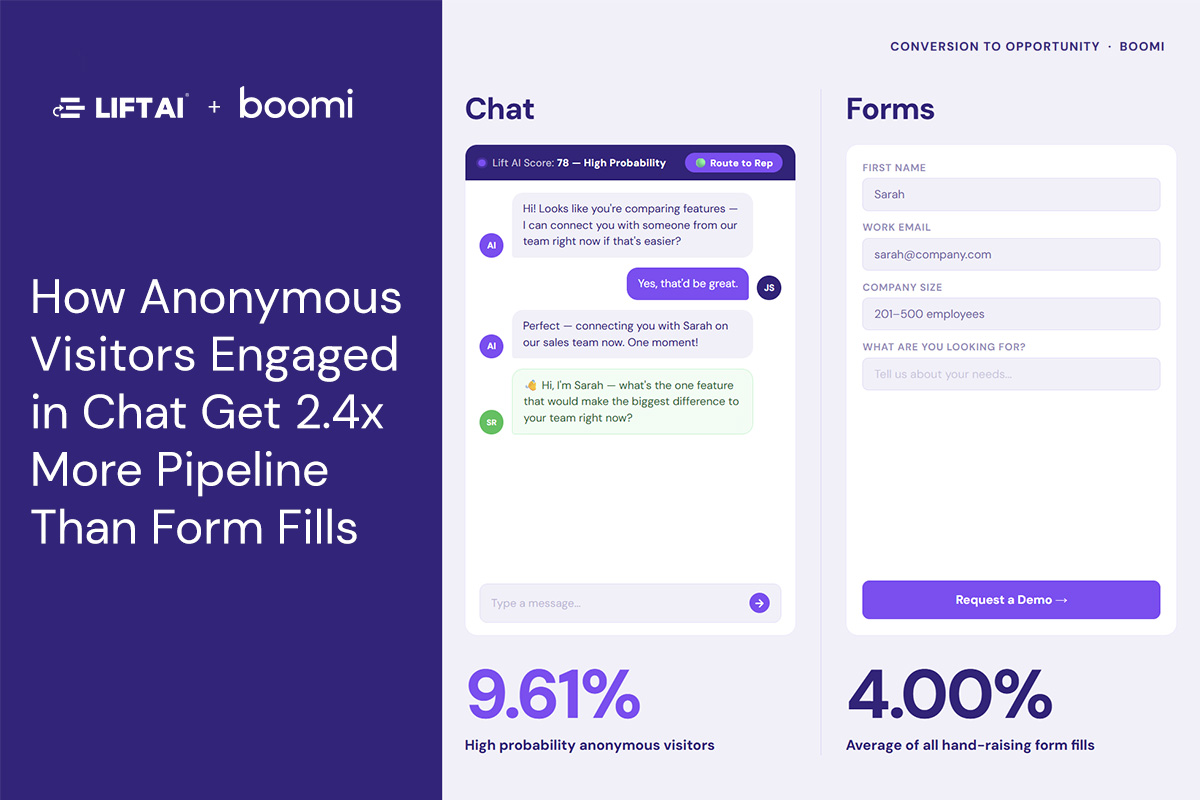
Lift AI identifies the buyer intent of all visitors to your website (even anonymous ones) using a unique machine-learning model trained on billions of data points and more than 14 million live sales interactions.
When a high-value, high-interest visitor lands on your website, Lift AI automatically connects them to your BDRs through any chat platform you already use (e.g. Drift, LivePerson). At the same time, lower-scoring visitors are delegated to a nurturing bot or a self-help guide instead.
As a result, you’ll see a lot of improvement in your sales metrics, such as the percentage of conversations that become pipeline, the number of conversations per deals closed, as well as the number of closed deals overall.
In fact, within the first 90 days, Lift AI customers have reported an increase in chat conversions anywhere from 2 to 10 times. Formstack grew its pipeline by 88%, while PointClickCare — 400%.
Try Lift AI free for 30 days. No credit card or IT help required. Just copy and paste a small JavaScript snippet to your website to start.
Maximize the productivity of your sales team with Lift AI and get rid of inefficiencies associated with talking to visitors who aren’t interested in buying your product. After all, that’s what sales metrics tracking is all about.