Updated Feb 6, 2024: We’ve added more information on understanding sales metrics as well as the latest case studies.
As any sales manager knows, accurately tracking the performance of sales reps can’t be done by looking at a single metric, such as a revenue target. Sales performance indicators are complex and differ between industries, companies, and products.
At the same time, finding key metrics based on your sales strategy and sales process is essential. Measuring whether you have enough closed opportunities this quarter or the value of your sales pipeline can be a representative reflection of your sales team’s productivity.
Besides, sales managers can use sales metrics to assess, for example, how quickly new BDRs get up to speed, and whether the onboarding process needs to be tweaked.
Leveraging effective metrics to understand what works for your sales organization is incredibly valuable. But you can only get those insights after you configure your sales tools to track the right things.
Tip: Connect your BDRs to a prioritized queue (based on buyer intent) of website visitors instantly with Lift AI.
Understanding Sales Productivity Metrics
Sales metrics are key performance indicators (KPIs) that track your sales team’s activity against pre-defined benchmarks.
You can use sales metrics to ensure your team is on track to complete their sales goals, award bonuses for outstanding performance, or identify issues before they become too serious to ignore.
One of the critical tasks that sales leaders have to do is to select the most important sales metrics for their team, as sales reps will adjust their behavior accordingly to maximize them.
10 Key Sales Productivity Metrics to Monitor
Here are 10 effective sales performance metrics that would help you track sales activity across the whole company:
- Total sales revenue
- Average deal size
- Average revenue per customer or product
- New vs. existing customer revenue
- Average conversion rates by funnel stage
- Year-over-year growth
- Customer lifetime value
- Net promoter score (NPS)
- Quota attainment
- Sales expenses
1. Total Sales Revenue
Revenue is the most fundamental sales activity metric. Knowing how much revenue your sales team helps generate every quarter (or month, or year) is key to benchmarking and improving performance.
The standard way of tracking total revenue is calculating it for the same reporting period (e.g. a quarter), which would require dividing an annual contract by four, for example.
For SaaS products, it’s more common to calculate monthly recurring revenue (MRR) or annual recurring revenue (ARR), which better reflects the actual cashflow and future expectations.
2. Average Deal Size
Your total revenue consists of many deals closed throughout the reporting period. But since each sale takes time and energy from your team, most sales leaders prefer to land a few large deals instead of hundreds of small ones.
Tracking the number of deals and the average deal size would refocus your team to prospect for larger clients. While this can increase your customer acquisition cost (CAC), it will also increase your customer lifetime value and average revenue as a result.
3. Average Revenue per Customer or Product
Another way to track sales metrics is not in terms of the average deal size but average revenue per each customer or product.
This sales performance metric is useful when you have repeat customers with lots of subsequent sales. Focusing on their needs can greatly improve sales productivity, as it’s much easier to sell to an existing customer than to find a new one.
Alternatively, you can identify your best-selling products or the ones with the highest profit margins, and restructure your sales process to focus on them. This could mean creating new sales campaign materials, retraining sales reps, and prioritizing other key performance indicators (e.g. market penetration).
Note: Having a sales process dependent on a few products can be as concerning for your sales pipeline as having too many. The key is finding the right balance.
4. New vs. Existing Customer Revenue
Even when your sales reps concentrate on upselling or cross-selling existing customers, it’s important to keep your sales pipeline busy with new prospects.
Once you start tracking new vs. existing customer revenue, you can see which side of the equation needs more effort to ensure your average sales cycle length stays about the same in the future.
5. Average Conversion Rates by Funnel Stage
To improve your sales process quickly, it’s best to find the smallest moving parts you can work on. For example, track the opportunity-to-win ratio of each stage in your sales funnel. That alone would immediately tell you which where you can improve sales effectiveness, and whether you need to invest in sales training or other resources.
6. Year-Over-Year Growth
Tracking total revenue, monthly recurring revenue, or annual recurring revenue over multiple years gives you one of the most powerful sales performance metrics — year-over-year (YoY) growth.
Year-over-year growth is expressed in percentage terms and reflects the quality of your sales processes and consistency in sales productivity. Plus, it gives you a longterm sales trend that you can extrapolate from further.
7. Customer Lifetime Value
Your sales reps should be able to estimate the lifetime value of engaged prospects or new customers based on your historic sales data. Prioritizing accounts with higher customer lifetime value (LTV) helps focus your sales efforts and improve the right sales performance metrics.
It’s possible for LTV to drop below the average revenue generated per deal, which would mean that your new customers are cancelling their orders or dropping off in other ways before their contract is done. This would be a clear signal to improve your product and require a detailed discovery process with your target audience.
8. Net Promoter Score (NPS)
One of the most popular sales productivity metrics for assessing how fast your product spreads within its target market is a net promoter score (NPS). When your existing customers (as well as new customers) are more likely to recommend your product to others, your NPS score improves.
The NPS metric goes from 1 (not very likely to spread) to 10 (very likely to spread), with excellent scores being considered those between 8 and 10.
9. Quota Attainment
Do you know what percentage of your sales team reaches its sales quota in any given time period? Or what’s the percentage of the quota attained by your sales team on average?
Low quota attainment can signal the need for more coaching, more sales capacity, and even a low-quality product.
In addition, finding out how other important sales metrics affect quota attainment can help you select key priorities for improving sales productivity.
10. Sales Expenses
Reaching your sales quota every quarter is great, but how much are you spending to do that?
Sales teams should keep track of their sales expense ratio, including sales tools, campaigns, staff, operating expenses, and other customer acquisition costs.
Being in the red while starting up is normal, but you should ensure that your sales team is on the steady path to profitability if you want other sales metrics to matter at all.
Advanced Metrics for Sales Productivity Analysis
Once you cover the 10 key sales productivity metrics above, you can move to the more advanced ones, such as the weighted pipeline value, sales ramp, and percentage of leads dropped.
Weighted pipeline value is important because it shows how much total revenue is moving through your sales pipeline at any given moment.
To calculate it, you multiply expected deal value by the probability of it closing. So if you think that a $100,000 deal is 80% likely to close, the weighted value of that deal is $80,000. Do this for every active deal and add them all together.
Sales ramp measures how long it takes (on average) for a BDR, account executive, or sales manager to get involved in the sales process.
To calculate the sales ramp, measure the average number of days it takes for a new salesperson to hit their quota.
Note: Sometimes salespeople are given active deals that are well on their way to be closed. So make sure to adjust the final sales ramp number accordingly.
Percentage of leads dropped is one of the non-obvious key sales metrics that can point to hidden issues with the quality of leads and the capacity of your sales professionals.
To calculate it, divide the number of dropped leads by the total amount of leads generated.
Implementing Metrics for Maximum Impact
All the sales productivity metrics listed above are important to track. But where do you start? And what solutions should you implement first?
Since sales organizations and sales teams differ a lot, start by tracking sales data and combining sales metrics in a single dashboard. There are a variety of CRMs you can use for that purpose, from HubSpot to Salesforce to Pipedrive to Zoho.
After that, it’s time to integrate those sales metrics into your sales strategy.
For example, improving the conversion rate is one of the most effective ways to increase revenue while simultaneously reducing the amount of time your sales representatives spend on opportunities that go nowhere.
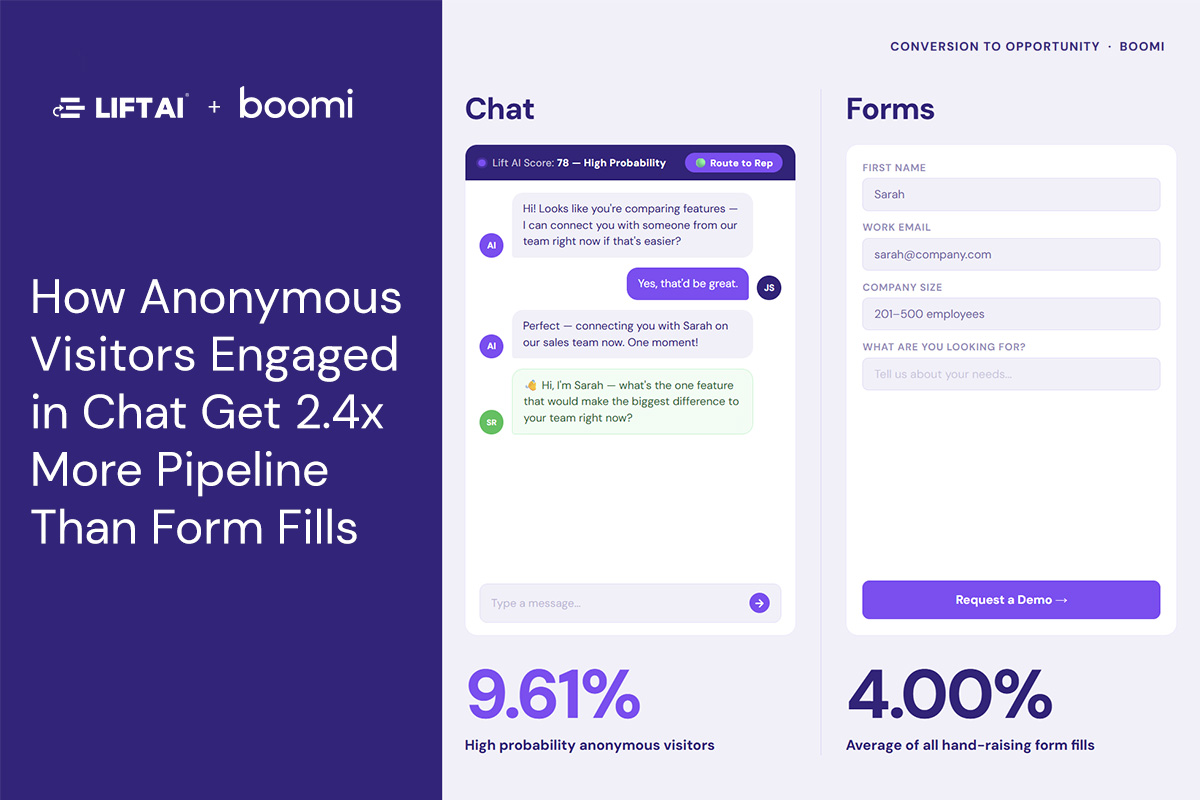
Nearly all websites today rely on live chats as a way to connect potential customers directly to BDRs. However, few companies know which website visitors are actually interested in buying their product or service. In other words, which of them have high purchase intent.
The easiest and fastest way to fix that is to use a tool like Lift AI, which automates the web visitor qualification (scoring) process and connects BDRs with the ones that have the highest likelihood to buy.
Lift AI is an automated solution that instantly identifies the buyer intent of every single visitor that lands on your website. Even anonymous ones that haven’t been previously recorded in your CRM.
To do that, Lift AI leverages its unique machine-learning model that was trained on billions of data points and more than 14 million live sales interactions. It uses that data to determine buyer intent based on micro-behaviors on your website in real-time, with over 85% accuracy.
Here’s how Lift AI works when integrated with a chat platform (e.g. Drift). As visitors navigate through your website (even if it’s one page), Lift AI gives them a buyer intent score based on their behavior. This score gets constantly updated. If that visitor score reaches the “high intent” threshold, you can create a custom playbook for what happens after. For example, a visitor that’s likely to buy can be connected directly with the next available BDR through chat while lower-scoring visitors can be redirected to a chatbot or a self-help guide.
This ensures your sales team is only focused on buyers, helping them improve their conversion metrics and efficiency.
Case Studies and Success Stories
Implementing each of the sales metrics above shouldn’t take long, and most provide a quick boost in team performance.
However, few things can beat the effortless output that comes from installing Lift AI.
By finding leads with the highest buyer intent, Lift AI can increase your chat conversions anywhere from two to 10 times within 90 days. All by having your BDRs talk to higher quality website visitors, even without traffic growth.
For example, Chronus, one of Lift AI’s customers, got 85% of their Drift pipeline from completely anonymous visitors that would have otherwise been missed. Truckstop increased its sales efficiency by 3 times (9.72% vs. 3.28%). Drift had its conversions go up 9 times.
You can see how other sales metrics can grow due to Lift AI integrations with your marketing stack as well, from total sales revenue to average revenue per customer. After all, now fewer BDRs can close more deals.
Want to see Lift AI in action? Sign up for a free proof of concept that Lift AI offers for companies with over 20,000 monthly visitors. Just reach out to the Lift AI team and see your sales opportunities and monthly revenue grow with little to no action on your part.